
Beat the rust - stay classy with WAVA
A look under the bonnet of some classic cars

From an early age, I've had an unexplained fascination for rusty old machines. It's a feeling that becomes even more intense if I see that they've been stamped with a number. I find myself imagining how they were once so ubiquitous or unimportant that they were mere numbers in a list. But yet here they are, continuing on, exuding so much character and a dogged ability to have survived until this point, whilst all their fellows have disappeared. It's hard to believe that these magnificent survivors were ever appreciated so little as to be given numbers, not names.
As runners we tend to have a fondness for numbers, but we also have an unfortunate tendency to rust up a little as the years advance. It's unlikely you'll ever see anyone over 40 win a major marathon, and Justin Gatlin at 30 was the oldest man in the 2012 Olympic 100m final. Of course there are exceptions, like Carl Lewis, who was still competing at the highest level into his mid-thirties, and Merlene Ottey, who was a semi-finalist in the European Championships at 46. But unfortunately we all have to accept that there comes a certain age when that Olympic gold medal is no longer within reach.
Fortunately, for all of us who are sliding down the wrong side of the hill on a tea tray, there's an insurance policy – commonly referred to as a WAVA Rating (this used to mean World Association of Veteran Athletes – the governing body for veteran athletes, but they call themselves World Masters Athletics now). In short, it's a way to measure your performances that takes your age into account.
The easiest way to explore under the bonnet of WAVA is to look at some numbers from Fetch. The first graph on the right shows you the fastest times recorded at 10k for Fetchies of all ages, from 16 to 77. Mrs Jigs, Mother Duck and Manc Girl are busily carving up the white curve for the ladies, whilst RunningBob, brotherjohn and oldrunner72 hold 14 of our men's 10k age records between them.
Interested in seeing the male and female tables?
WAVA works by using the curve on this graph to shape our universe. It doesn't use the absolute fastest times in the world, because I think we'd all agree that there's something quite unique about people like Usain Bolt. But with a bit of statistical deep breathing, it's possible to generate a nice smooth curve that shows the current limits of what's possible at every age.
The curve is then flipped upside down - think of it as a graph showing relative race speed. It's the second graph on the right - you can see the official smoothed-out WAVA curve for men's 10k in yellow, and our unsmoothed Fetch men, bubbling away just underneath. The yellow line tells us that a sixty-year-old man who runs a 10k at four-fifths of the speed of the world-record holder should consider himself to be just as much of a world-beater as Mr Bolt.
These curves have changed shape a few times over the last twenty years, particularly in women's running. Tenacious ladies like the ones I've mentioned above have redefined boundaries, pushed envelopes, shattered ceilings, and kicked asses!
We can't all be pioneers or ass kickers, but we can all work on improving our lot and keeping our bodywork rust-free for as long as possible. Let's concentrate on that sixty-year-old man, and imagine him running his 10k at four-fifths of world record speed. WAVA automatically gives him full marks – a 100% WAVA rating, top of the pile. But if you're the same age and gender, and can run at half the speed he does, then you score 50% WAVA. If you run at three-quarters of his speed, you get 75% WAVA – and so on.
You may never knock that man off his pedestal, but you can enjoy climbing as high as you can, safe in the knowledge that when your next birthday comes, the summit gets that little bit closer - all you need to do is hold on!
This might all seem pretty complicated, but the good news is that all the numbers and sums can be squeezed into a calculator small enough to fit in a web page. Enter your details to see your WAVA score:
This wonderful system paves the way for people to have fun competing with each other irrespective of age difference. It also enables you to compare races of different distances, and is a good way to work out what time to aim for when you move from one distance to another (although comparing a mile race to a marathon is always a bit of a stretch). It offers a small amount of compensation and a bit of fun to those of us that look back on PB's, rather than look forward to them.
Of course, what it ultimately does is boil down all that hard work, sweat, effort and achievement into a number – but in my eyes, that just makes it all the more fascinating, no matter how rusty you are.


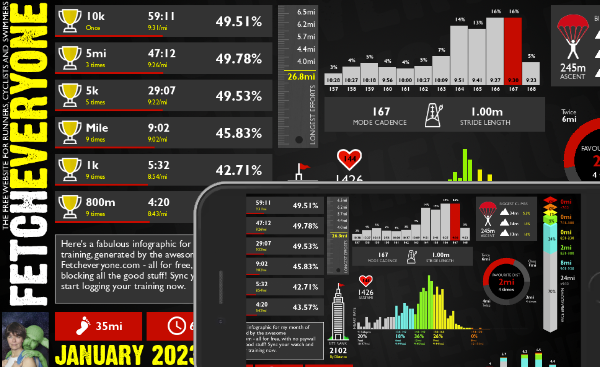
Monthly Summary
A brand new shareable infographic showing a colourful breakdown of your training month.

Marathon Prediction
We delve deeper to give you greater insights when working out your goal marathon time.
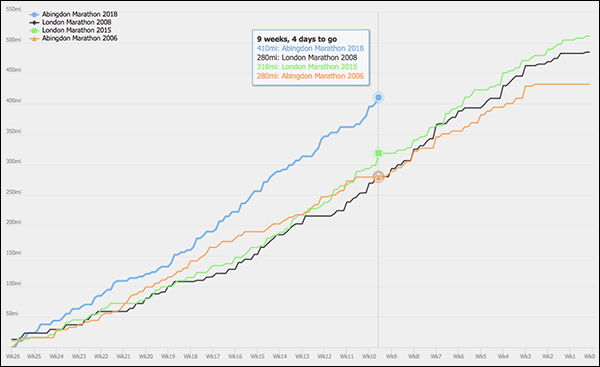
Pre-race Training Analysis
See your accumulated mileage in the weeks leading up to any event in your portfolio, and compare it to your other performances
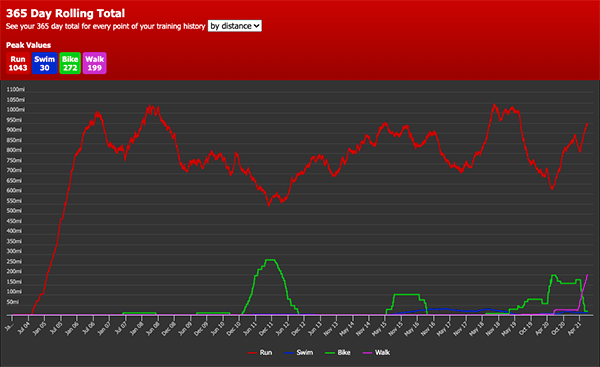
Your 365 Day Totals
Peaks and troughs in training aren't easy to find. Unless you use this graph. Find out what your peak training volume really is
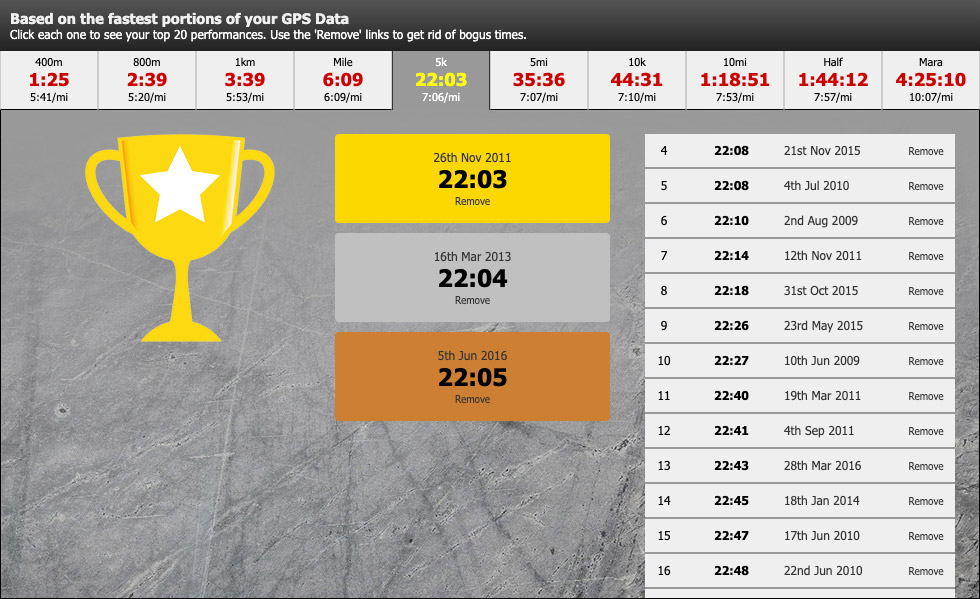
Benchmarks
See the fastest portions from all your training runs. Filter by time to give you recent bests to aim at. Every distance from 400m to marathon.
Fetch Everyone Running Club
Join our UKA-affiliated club for event discounts, London Marathon ballot places, the chance to get funded for coaching qualifications, and a warm feeling inside.
Leave a comment...
-
Now I understand very interesting thanks.

Neilio
-
Ooh you forgot to mention it makes ladies better than men. I mean we all know they are anyway obviously but WAVA *proves* it! :-)G
HappyG(rrr)
-
Brilliantly explained. This makes a lot more sense now!
RedWineRunner
-
Good article I've been banging on to my clubmates to look at the WAVA scores rather than times (as I'm older than most of them) and they'll see I'm beating some of them
Doctor K
-
Great article thanks. The women over 66 in the top graph appear to be disappearing into the stratosphere! I wonder if that's due to inherent bias in good older runners continuing and slow older runners giving up earlier?
fleecy
-
Thta's good to know as an oldie it gives me hope that I can compete on a WAVA length!!

Wendolene Wobbler
-
WAVA keeps me going. I NEED to hold my WAVA and in pushing to do so I not only end up with a higher WAVA but also this year 3 PBs. We now use WAVA scores to decide who's won what at our club awards night.
mikep
-
Excellent article - really well explained.
Dirk
-
Great run through the world of WAVA

PeterG
-
I thought that was pretty well-explained although WTAFleecy clearly struggled with the interpretation of the 1st graph.
paul the builder
-
Love WAVA's

Clueless
-
Never understood WAVA before this article has made it all clear now :). And way to go girls !!!
Chell
-
Excellent explaination.....now is there one for a tyre?

run free
-
Top man Fetch another brilliant article:)
Hyperboy
-
Very good timing. I will post on Watford Joggers website. We have a trophy for the mile. To be presented this year for the first time. Controversially as it turns out it was decided to go for best WAVA% to decide winners. Your calculation produces a slightly different set of numbers but the same result to our race officials

Muds
-
Can you please mention which WAVA tables your calculator is based on? I ask because some of the older calculators round the web still use older tables and so there can be a bit of discrepancy depending on which calc one uses.
NordRunner
-
It should be the 2010 tables which I think are the most recent - but I'm always keen to hear if you see a discrepancy. I think they represent an upward shift in vet ladies standards as mentioned in the article.
fetcheveryone
-
There are now 2015 tables, are you going to upgrade to using these?
chunkywizard
-
Noticed that here and on the parkrun website (for example) there's been no update to use the 2015 tables (which would strip me of some nice 70+ scores!). Any plans to update the tables (and put up with the groans of the majority as our performances get downgraded?)?
larkim
-
As when there is more than one set of tables you will get people making comments, my feeling is go with the set of tables you like and stick with them. Good article nicely explained. Thank you Fetch
M&Ms
-
Good explanation of how you calculate this. There is a more robust statsistical methodology however (as used by educational age standardised assessments like PIPS and CATS). You could use all the real life Park Run 5k data and create a rank order for each age/gender group. The median score would then provide the baseline average (this could be given a standardised score of 50, with an SD of 15. Thus anyone with a score of 75+ would be in the top 5% (or just provide a simpler more user-friendly percentile ranking of 95). This would be a more reliable measure because it would be based on a significantly larger sample, not just an individual athlete's 'world best' time. It would also tell people exactly where they fit on the leaderboard within their Park Run cohort.
PerryDigweed
To comment, you need to sign in or sign up!So are standards a direct comparison against WAVA?
And do they take the best 3 times from the seven race categories?