Any Way The Wind Blows
The impact of wind on running pace

You can tell when British Summer Time has officially started. Forget all that stuff about clocks - just look out of the window. It's piddling down, and your recycling bin is half way down the street with its contents tastefully distributed through your neighbours gardens. At least, this was the scene that greeted me as I peeked through the curtains on the morning of the Oakley 20 - our last big long run before the London Marathon.
The race itself went pretty well - the rain had stopped, and we just about coped with the wind. But it got me thinking about how much impact the wind can have on our running performances. It certainly was a factor for us - a 25mph southwesterly with 45mph gusts can really take your breath away - but it gave something back too, getting right behind us in the penultimate mile.
One of the cool bits of my job is having fun with data analysis on a large scale. It occurred to me that I could break my GPS data down into eight different compass directions, and work out the distance and time (and therefore speed) in each direction, in the hope that it would illustrate the effect of wind. After an afternoon of fiddling around with the code, I ended up with an interesting new addition for your training log.
It's difficult to isolate the wind factor when there are so many other elements in play - and there certainly were plenty at Oakley. In road racing terms, it's a hilly one, with 271 metres to climb - enough to have an impact on anyone's pace. And undoubtedly, fatigue plays its part in a race of this length - although I'm pleased to say that we held on pretty well towards the end. So for these reasons, I won't use it as an example; and when you look at your own data, bear this in mind.
But anyway… by luck I did have a suitable run to look at. A few weeks ago, I'd done a six mile tempo run, comprising four oval laps around a local park. It was pancake flat, the surface was excellent, I nailed it from start to finish, and there was a noticeable westerly wind. My jazzy new bit of code generated the following table which (assuming you have a GPS watch) you can now see on the detailed view of any of your runs. It shows my mile pace in each compass direction:
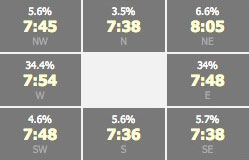
The oval shape of the lap meant that I spent the majority of my time running either east (34%, or about 2 miles) or west (34.4%, 2.04 miles) - and pleasingly, I can see that I was running six seconds per mile faster when I had the wind behind me. I'm not too concerned about the other compass points as they only make a small contribution to my overall distance.
I saw this pattern with other runs that I'd done. An out-and-back on the local canal path was noticeably quicker with the wind behind me, and a recent 12 got a lot easier when I'd finished battling the northerly wind.
It took me back to the Fenland 10, which we ran in October last year. It's renowned for being pretty flat, but as you drive towards race HQ, the presence of a few dozen wind turbines provides the first clue that there may be other factors to overcome. The race was going wonderfully well until about 5.4 miles, when the course turns a corner, and the wind hits you like a cow that's late for a meeting. By the time the course changed to a more friendly direction again in mile nine, my chance of a PB had been literally blown away. Here's my chart for the run:
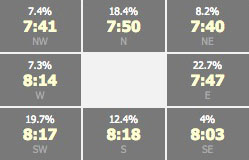
As you can see, there's a huge difference when running southwest into the wind! Everyone I spoke to suffered a similar experience. There were lots of Fetchies there, and so I dug out their GPS data, and the results back this up. Every single one of us was slower in the southwest segment. As a group, our southwest running was on average 1.6% slower than race pace. Running east was the most profitable, bolstering our pace by 2.2%; and likewise, when heading north we were 1.2% quicker. Of course, the real test would be to run the race again in reverse, and have the wind blow from the same direction. Maybe next year!
Ultimately, only you can know whether the wind played a part in your run - but on days when the street is covered with letters you wish you'd shredded, at least you'll have some interesting stats to look forward to when you get home from your run. I hope you enjoy it.

Monthly Summary
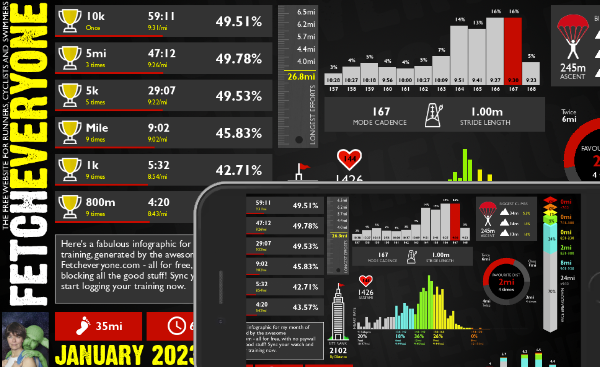
A brand new shareable infographic showing a colourful breakdown of your training month.

Marathon Prediction
We delve deeper to give you greater insights when working out your goal marathon time.
Pre-race Training Analysis
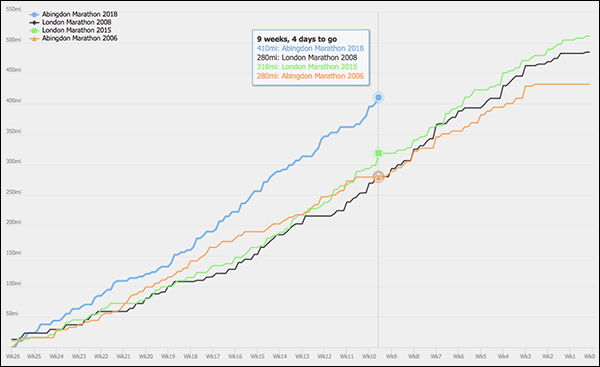
See your accumulated mileage in the weeks leading up to any event in your portfolio, and compare it to your other performances

Your 365 Day Totals
Peaks and troughs in training aren't easy to find. Unless you use this graph. Find out what your peak training volume really is
Benchmarks
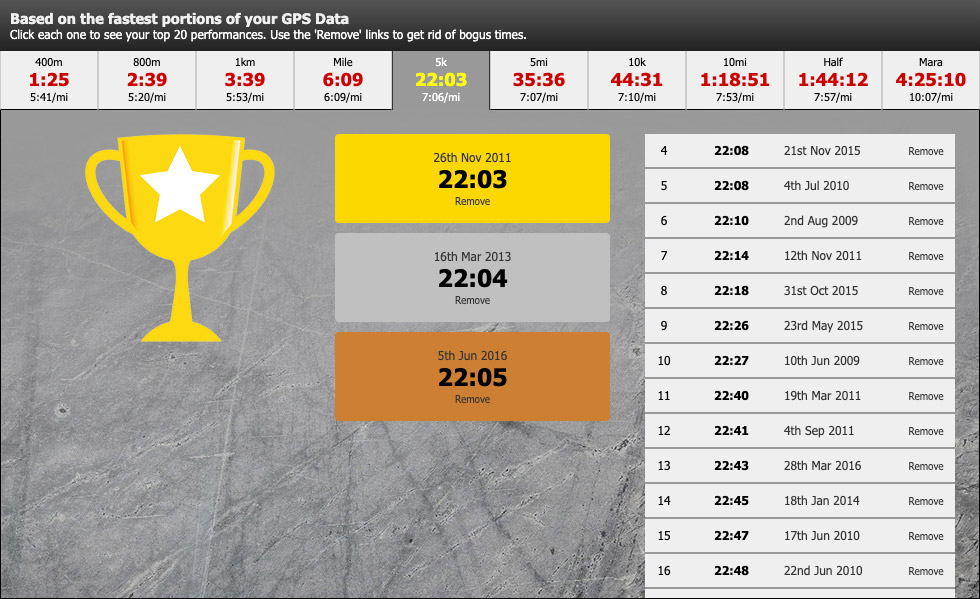
See the fastest portions from all your training runs. Filter by time to give you recent bests to aim at. Every distance from 400m to marathon.
Fetch Everyone Running Club
Join our UKA-affiliated club for event discounts, London Marathon ballot places, the chance to get funded for coaching qualifications, and a warm feeling inside.


Leave a comment...
-
It's fascinating to look at the details in a run. I can see that this feature will show interesting results; comparing the same route on different days with different wind direction and force, for example. Great stuff!
GimmeMedals
-
Interesting...

Ness
-
... doesn't really matter to me. To me
 (sorry no point in wasting a good song lyric)
Corrah
-
It is interesting, and another one to add to the list of excuses-in-advance...

Helegant
-
As a test I did a marathon which was 8 laps of an exposed airfield and it is pretty good: I am almost 30 seconds a mile faster with the wind behind rather than into me. Useful knowledge if you know you are in for a windy race and want to get the pace right
philip_m_jones
To comment, you need to sign in or sign up!http://www.fetcheveryone.com/training-log-view.php?id11076068