


Being Below Average
And why it doesn't hurt one bit.

I think I was a bit of a weird kid. Our garden backed onto the A469, and I used to perch on the bumper of my dad's Ford Transit, writing down the number plates of the cars that whizzed past. I'm not sure why, but it kept me amused.
I harboured a fascination for tables of data and statistics that began with memorising the match scores of Steve Davis, and blossomed as I fell into the statistical sea of Test Match cricket. My first forays into programming involved databases of cricketers and measuring their relative merits. I was born in a mining community - I just preferred data to anthracite.
It makes perfect sense, therefore, that my love of running extends beyond the simple joy of moving from place to place under my own steam. I am smitten by the endless opportunities to measure, rank and rate everything I do.
It doesn't matter to me how good I actually am. By definition, at least half of all runners have below average times (myself included). One of the people reading this will be the slowest runner I've ever met, and all bar one of you will not be the best runner I know. So what?
Even the slowest runner is (to use a hackneyed phrase) much faster than the people who don't run at all. And (to use another one), you're only competing against yourself. But before I invite you all to join me in a rousing chorus of "I am what I am", I hope you'll agree that it can be kind of fun to see where you are, particularly if it gives you the motivation to climb that ladder, no matter what your starting rung.
Comparison with others is essentially as futile as collecting car number plates – and yet it's still something that most of us do. I expect that most of you will have wondered about how your best times compare to other runners, whether it's your parkrun nemesis; or Nigella from running club; or maybe even absolutely everyone! My beginners group tackled their first five mile race on the weekend, and there was some (unfounded) concern amongst them about the prospect of coming last. I made sure they saw the warm reception that the final finisher received, because I'm proud of the way our sport looks out for every single runner, irrespective of ability.
But with the caveats out of the way, I thought it would be good fun to generate some tables allowing you to compare yourself with absolutely everyone. I spent some quality time with the Fetch database, and generated some tables that highlight the range of race times that make up our community. There are lots of us! Over 7000 Fetchies have recorded a marathon time, and over 10,000 of you have completed half marathons; but 10k's are the most popular. You don't hang about either - about 500 Fetchies have run a sub-36 10k, and 100 have gone sub-33!
View the table
The tables can also be filtered by gender and age - two factors that no amount of training mileage can overcome. It has the potential to provide a more level playing field - although for me as a 39 year old male, it makes things that little bit tougher. My best 10k time of 46:44 means I just make it into the top 48% of all-comers - but when I look at the fastest men over 39, I'm only in the top 61%! The best route for me to become an above average 10k runner is to find a way to age 11 years!
It's fun to play around with the data and try some different permutations. Only 16% of men, but 19% of women meet the London Marathon 'Good For Age' criteria for senior athletes. We have 829 runners who have completed marathons in their 50s (and much older too) showing that it's very rarely 'too late'. And despite coming very nearly last in my school year group at our 100 metres time trial, the tables tell me that I fare better at shorter distances than at long ones.
Have fun playing with the tables, and planning your assault on your own personal conquest. Smash your way into the next percentile, or look along the rows and try to improve your times at distances where you're lagging behind your best. Or sit by the roadside and watch the cars drive by. It's all good fun.
View the table

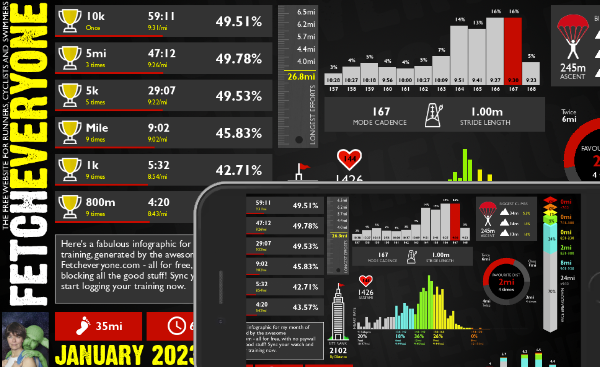
Monthly Summary
A brand new shareable infographic showing a colourful breakdown of your training month.

Marathon Prediction
We delve deeper to give you greater insights when working out your goal marathon time.
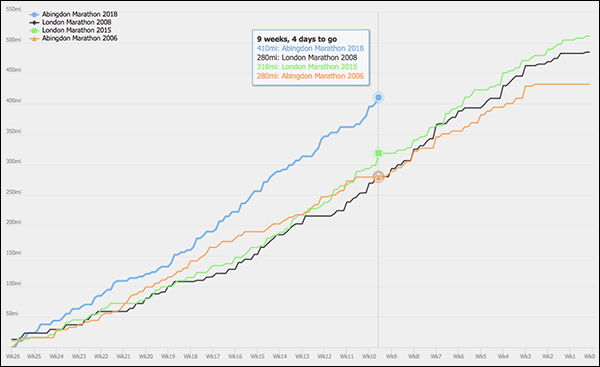
Pre-race Training Analysis
See your accumulated mileage in the weeks leading up to any event in your portfolio, and compare it to your other performances
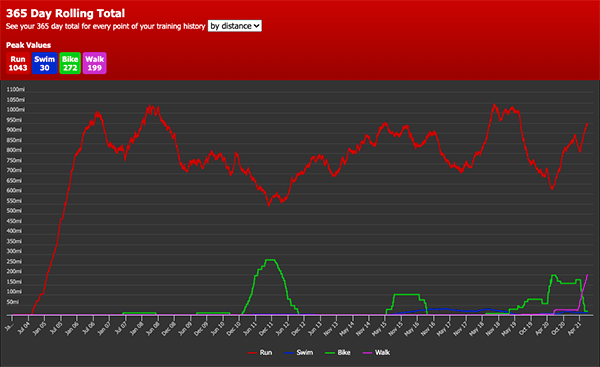
Your 365 Day Totals
Peaks and troughs in training aren't easy to find. Unless you use this graph. Find out what your peak training volume really is
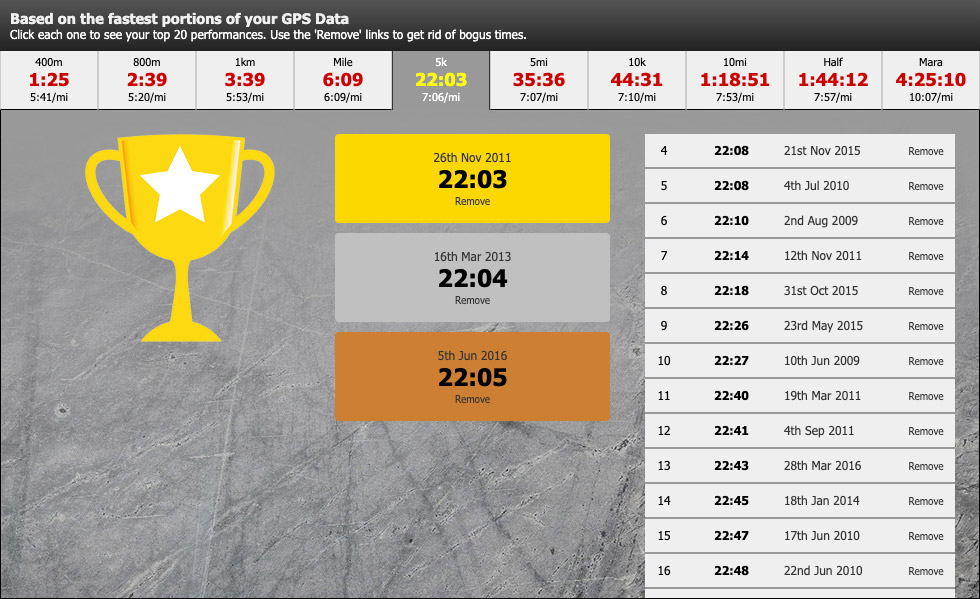
Benchmarks
See the fastest portions from all your training runs. Filter by time to give you recent bests to aim at. Every distance from 400m to marathon.
Fetch Everyone Running Club
Join our UKA-affiliated club for event discounts, London Marathon ballot places, the chance to get funded for coaching qualifications, and a warm feeling inside.
Leave a comment...
-
Right there with you and the pages and pages of number plates!
Bluebell2325
-
It was bus numbers for me!
Totoro
-
The good news for me is that I can only improve

Lemon10
-
Good words and bad words - add up the number of the place of the letters in the alphabet for a word and if it divisible by the number of letters in the word then it is a good word. e.g word 23+15+18+4 60 which is a multiple of 4, so Word is a good word.
Chrisity
-
Statto!
 Happy Monday Fetch!
  G
G
HappyG(rrr)
-
Oh now I need a graph of my % placings I go from 25% for a mile to much better for the marathon. Those were the days!
BigChiefRunningBore
-
Oooo graph of the results would be good! I'm also intrigued by the fact that if I pretend I am 45 yr old man I do worse than if I leave the boxes alone... 45 yr old men are clearly fast and likely over represented on fetch.
Curly45
-
Fetchies are speedy!
Winded
-
Me and my best friend used to write down the numbers on telegraph poles on the bus route home. And get really frustrated about the ones we couldn't see because we were going too fast... We had a notebook full of them. Utterly bonkers.
tashinka
-
Train spotting for me with extra ticks in the book if you managed to get on the cab of the engine.Happy Days.
Neilio
-
Cricket Stats!! Spotting Red Jaguars from the car. At my best in the top 34% for age :-), except for Mara, hopeless there.
Ocelot Spleens
To comment, you need to sign in or sign up!I can imagine one or two people in some age/gender combos really skew the %s for the few others in those combos...
I came across analysis of some large numbers here: runningusa.org The number finishing a half in under 2 hours is radically different to Fetch, I suspect the median is too.