New Glasses View - Coming Soon
31 watchers
|
Feb 2014
9:26am, 4 Feb 2014
13,960 posts
|
fetcheveryone
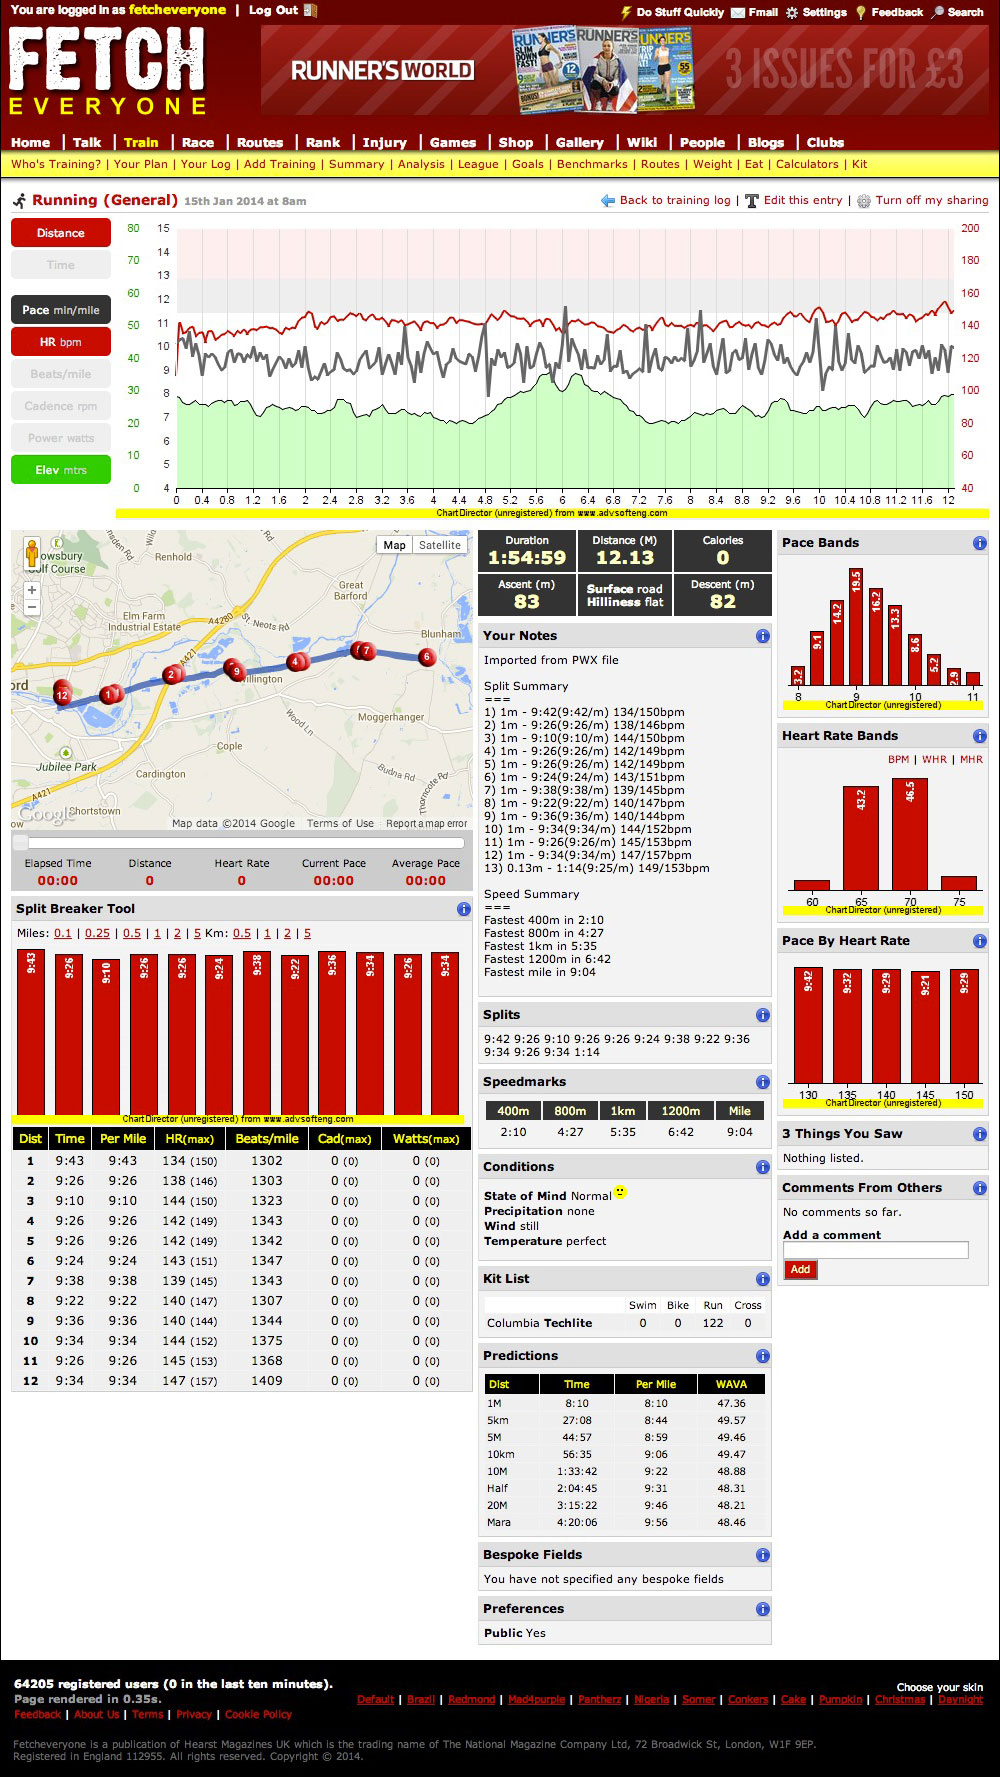
I've been working on the 'glasses' view in your training log - here's a screenshot of where I'm up to: http://www.fetcheveryone.com/images/glasses_20140204.jpg Key things: 1) the big graph at the top, with options on the left for overlaying various things 2) new little graphs on the right showing pace bands, hr bands, etc. Will show cadence and power if you record them. 3) little blue info icons, to help guide you on each section 4) split breaker tool on the left. It would be good to get a variety of files to test with, so I can see how the graphs perform. Things like massive bike rides, anything to do with swimming (indoor and outdoor), runs with footpods, runs on treadmills, interval sessions, hill sessions, hilly runs, high altitude runs, big pauses, loss of satellite accuracy half way through - anything that might produce some unusual results. If you've got files for anything like that, please could you email me a copy of the file (explaining what phenomena you're providing). My email address is ian@ you know where (attempting to minimise spam by not including the whole thing). Thanks, Me |
|
Feb 2014
9:38am, 4 Feb 2014
2,655 posts
|
ChrisThePuma
sends email to ian@youknowwhere.com |
|
Feb 2014
9:41am, 4 Feb 2014
10,759 posts
|
The Teaboy
Somebody's been out running on Route 51...
|
|
Feb 2014
9:45am, 4 Feb 2014
24,873 posts
|
Frobester
Ah, the oh-so-familiar Willington Track. I thought this was about the availability of Fetch to browse on Google Glasses...
|
|
Feb 2014
9:48am, 4 Feb 2014
13,962 posts
|
fetcheveryone
Thanks for keeping me company everybody whilst I wait for someone sensible |
|
Feb 2014
9:53am, 4 Feb 2014
6,092 posts
|
Wriggling Snake
to begin with i thought that looks a bit over fussy, then when I go back to the current one, it might be a little better, a bit less scanning up and down. is that sensible enough? |
|
Feb 2014
9:55am, 4 Feb 2014
2,656 posts
|
ChrisThePuma
I think he wants files, like FIT files, and other files that come from watches so he can test them - I may be wrong.
|
|
Feb 2014
9:58am, 4 Feb 2014
6,093 posts
|
Wriggling Snake
oh yes he does still I like it anyway, and not sensible at all |
|
Feb 2014
10:09am, 4 Feb 2014
13,963 posts
|
fetcheveryone
Thanks |
|
Feb 2014
10:14am, 4 Feb 2014
128 posts
|
Shortcut Cam
Nice one. All my Garmin data on 1 page.
|
Related Threads
-
 Query about training log display
Oct 2021
Query about training log display
Oct 2021
-
Uploads doubled?
Jun 2021
-
Training log tags - do they tell a story?! :-)
Jun 2021
-
Website query: My calendar view has changed.
Apr 2015
-
favourite activities
Sep 2014
-
Upload bike rides in MPH
Sep 2014
-
Speedmarks
Mar 2014
-
Benchmarks - what do the red and grey bars mean?
Oct 2013
-
update target mileage
Jul 2013
-
Export to ical
May 2013