
Mission Control: 10K
Training with added hindsight

When you've got a big race coming up, it's tempting to look for clues in your training to work out how things will turn out on the day. A recent race is always a helpful guide, using a Race Time Calculator - but if you've nothing to compare with, it can be pretty difficult to estimate whether you're destined for the stars!
Of course, it's always impossible to know exactly. The course may be hillier or rougher than you expected; the wind may be blowing a gale; you can get the fuelling wrong; you can mess up your pacing strategy, or have an unrealistic target in mind. You might be tired, hungover, or plagued by demons. Your shoelace could come undone.
And that's just race day! During those long weeks of training, there are an enormous number of variables at play. There are so many different training plans and methodologies, and variations enforced upon us by the pressures of life - it's hard to know where you stand.
Fortunately, we have a lot of data on Fetch - 75,000 10k performances, from over 10,000 runners. And of those performances, 25,288 come complete with oodles of information about the training that took place beforehand. Thousands of chunks of hindsight, enabling us to predict and shape the future!
When looking for patterns, it's important to think about things that might obscure them. For example, new runners are in an excellent position to set their best times. It's a guarantee in the first race of course, but a typical newbie will set a new PB three times in their first five 10k races. But by your 20th race, you're doing well if you've beaten your PB six times.
 This graph shows a count of your 10k races along the bottom, and your PB's up the side. For example, by the time you've completed ten races, the probability is that you've PB'ed four times.
To remove this "new runner" effect, the data was restricted to runners who had completed at least five 10k races. Further to this, the list of performances was whittled down to those runners who had set new bests. We can make the assumption everything went right on the day - and if it didn't, they at least got a PB - and it's hard to turn the idea of that down, right?
My study then looked at the ten weeks leading up to each of these performances, in order to establish some patterns in training. I grouped the runners into two-minute bands, and looked at their mileage, pace, and the amount of time that they committed to their training.
The overall training mileage graph below shows a strong correlation between training volume and race outcome. Faster runners tend to run more miles. But although this does seem to fit in with a lot of runners' experiences, there are statistical and common-sense factors that mean you should be cautious about making mileage your one and only king.
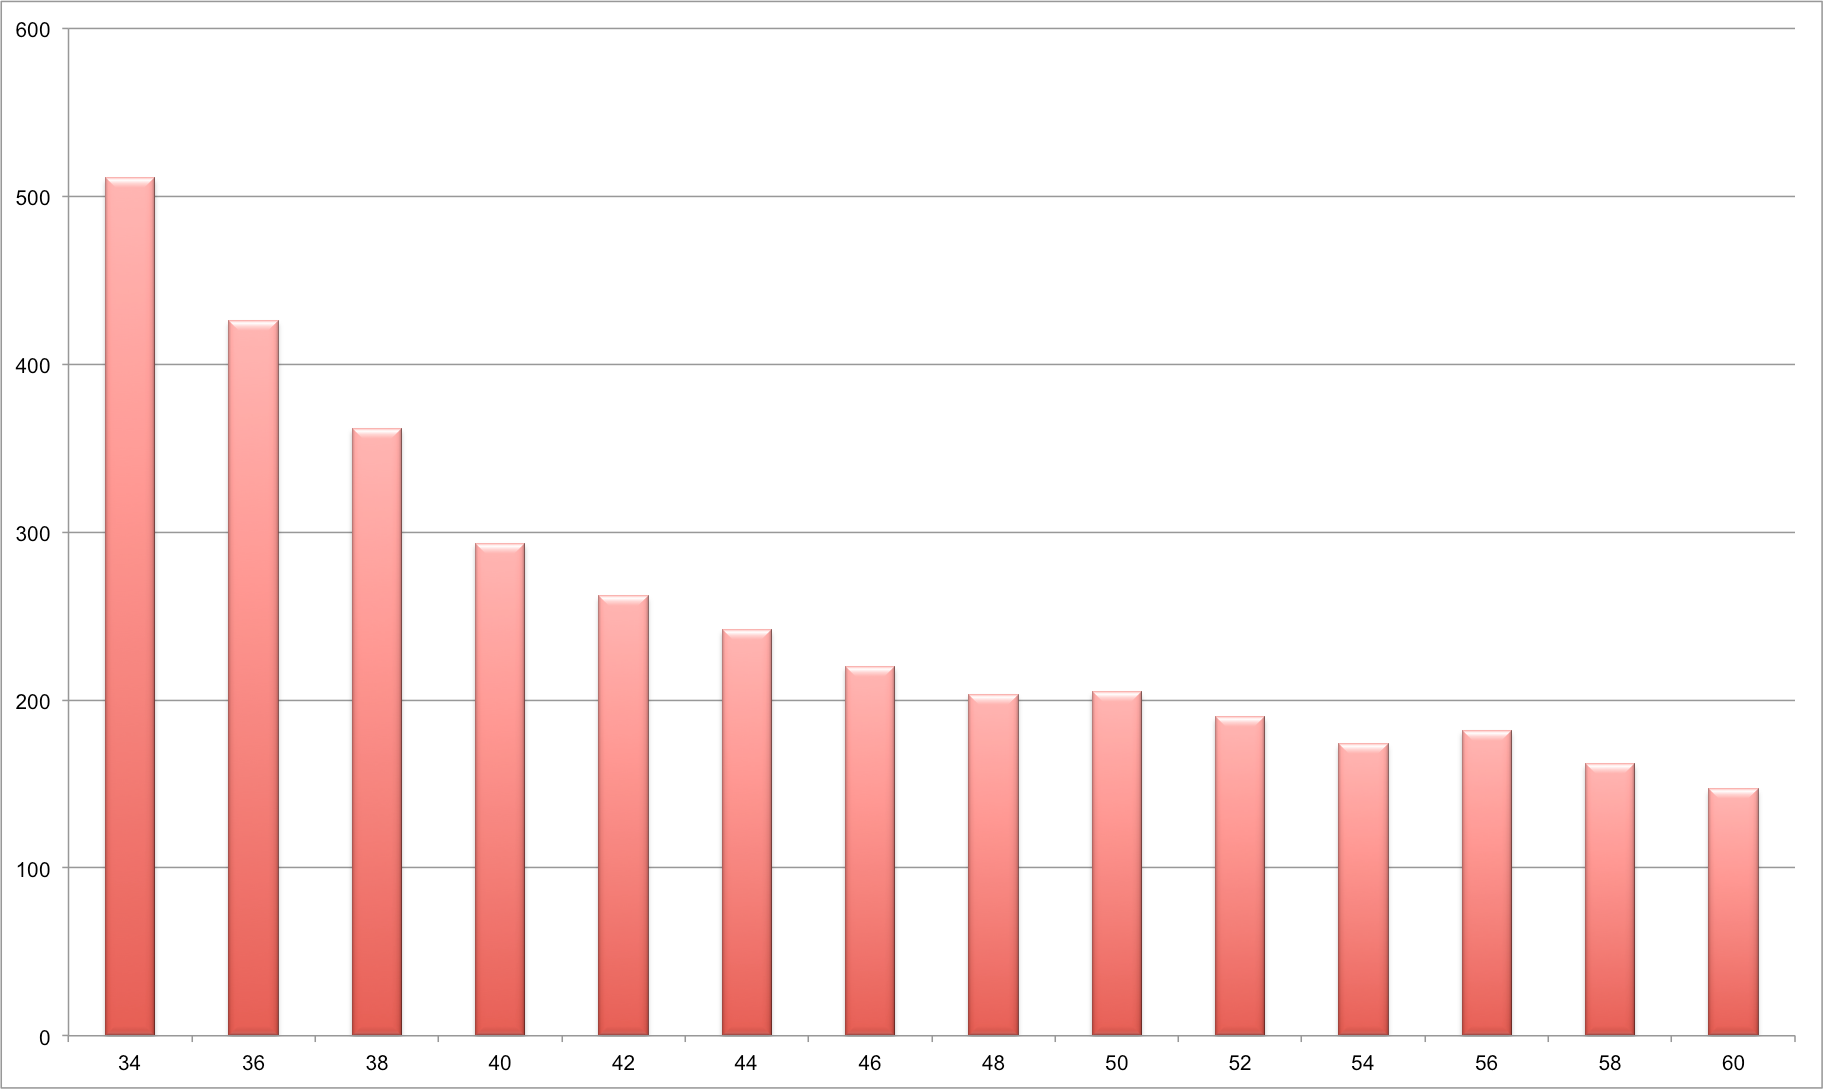 This graph shows the ten week mileage total for each time group.
For example, a typical 40 minute runner would run 294 miles (median) before the race.
This graph shows the ten week mileage total for each time group.
For example, a typical 40 minute runner would run 294 miles (median) before the race.Within each of these performance groups, there's quite a bit of variation. Within the 40 minute group (composed of 490 runners), the variation in mileage was reasonably large. Ten percent of them ran less than 190 miles in training, and ten percent ran more than 443 miles.
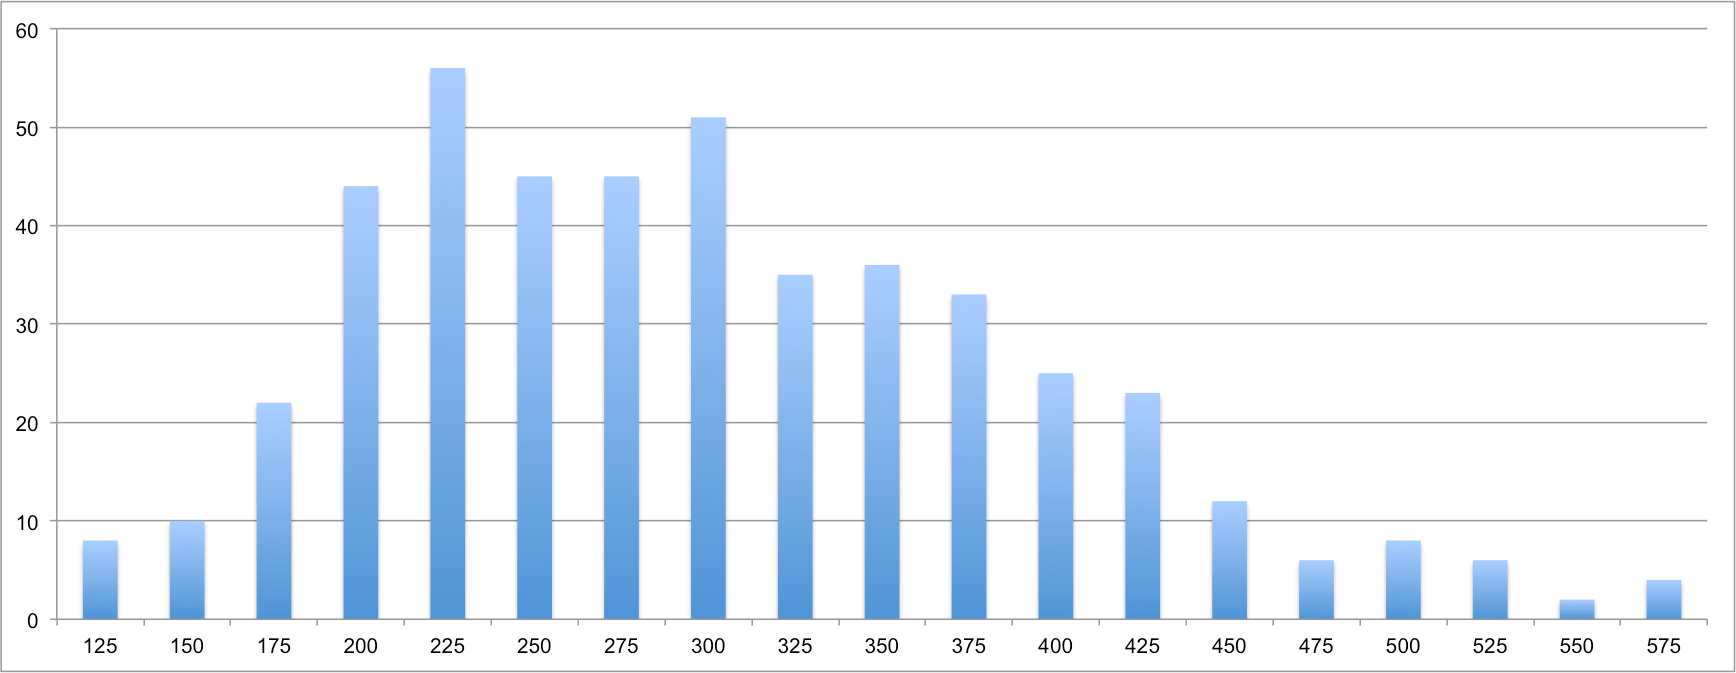 The training mileage of all the runners in the 40 minute group.
For example, 23 runners managed to complete a 40 minute 10k on just 175 miles of training.
The training mileage of all the runners in the 40 minute group.
For example, 23 runners managed to complete a 40 minute 10k on just 175 miles of training.It raises some questions that are unfortunately beyond the scope of this study. How do some runners manage a 40-minute 10k on much less mileage? Are the runners who do more than 300 miles wasting some of their efforts? If you have 300 miles to ‘spend', can you use them more profitably, and get a better race time?
Returning to our 10k performance groups, it's also clear that runners at the faster end of the scale devote more days to their running - but those of you who are considering running yourselves into the dirt should note that even 34-minute 10k runners devote at least two days a week to non-running activities. Rest is important!
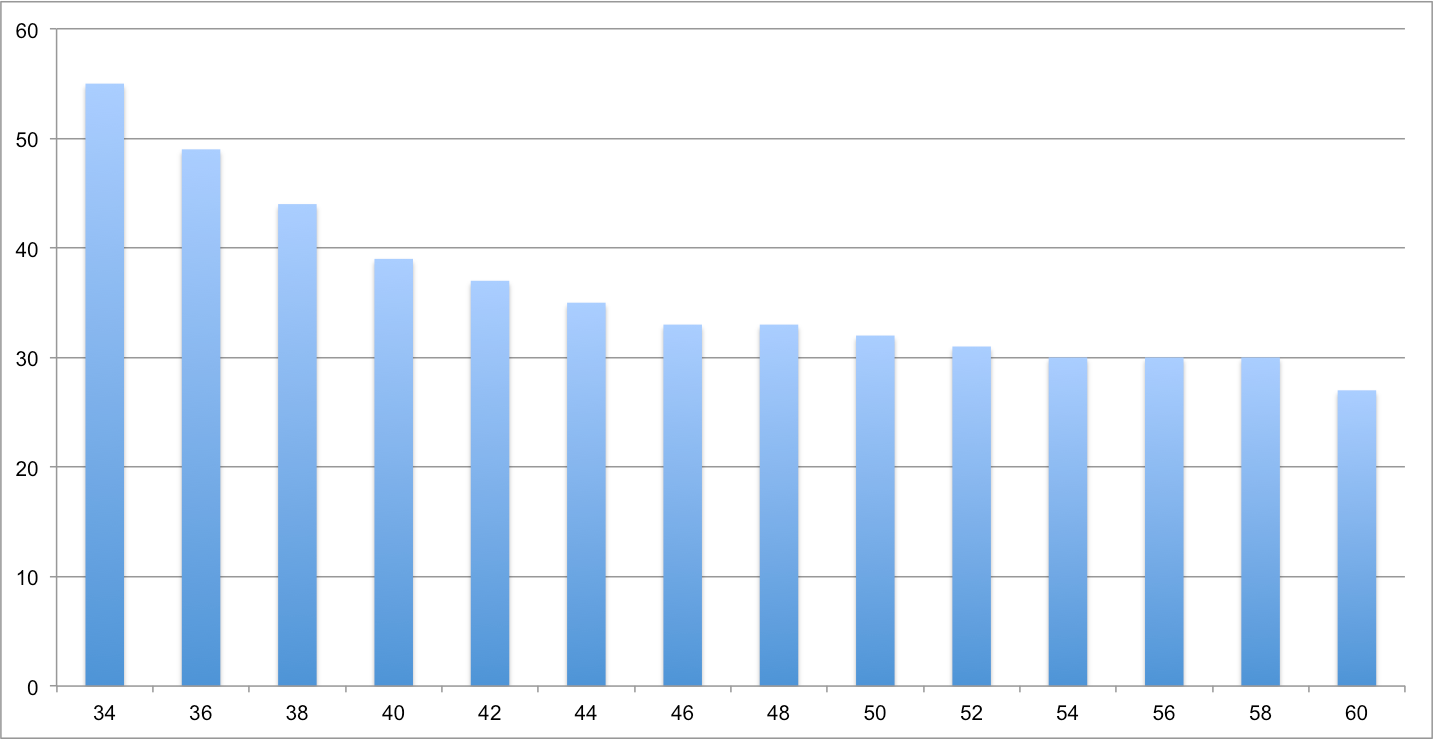 The total number of days spent running.
For example, a typical 42 minute 10k runner will run on 38 days out of 70 pre-race.
The total number of days spent running.
For example, a typical 42 minute 10k runner will run on 38 days out of 70 pre-race.But perhaps one of the key things to note is the relationship between race pace and training pace. Over the years I've seen lots of people who have set out with the best intentions to improve their times, but have tried to do this by going out and doing absolutely everything faster. And it often ends in injury or apathy, way before those glittering personal bests have taken so much as a scratch. Yes, it's likely that to get faster, you need to do some of your runs faster. But not all of them.

The blue line on the final graph (above) shows race pace (in minutes per mile) for each of our performance groups. The join between the green and orange bars represents the typical (median) pace that each group trains at. As a rule of thumb, typical average training pace is about 90 seconds/mile slower than race pace. The upper and lower bounds of the bars show the typical range of training paces that each group trains at. For example, the 40 minute group (that's 6:26/mile for a 10k) have an average training pace of 7:59/mile, but their recorded training entries typically vary from 5:46/mile down to 10:12/mile.
Yes, you heard that right. Even sub-40 runners will still include MUCH slower runs in their training regime. Diversity of pace is an important part of your training regime, irrespective of your abilities. As we've seen in Be Your Own Boss, the physiological benefits of training are heightened when you learn to target specific paces, and by remembering that each type of training run has a purpose and an associated pace - rather than going off like a rocket all the time.

Picture: Getty Images / Andrew Rich
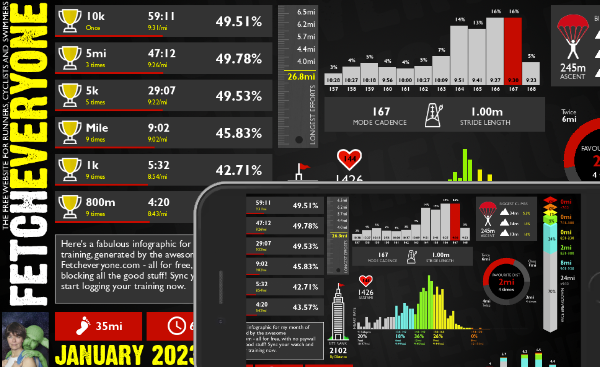
Monthly Summary
A brand new shareable infographic showing a colourful breakdown of your training month.

Marathon Prediction
We delve deeper to give you greater insights when working out your goal marathon time.
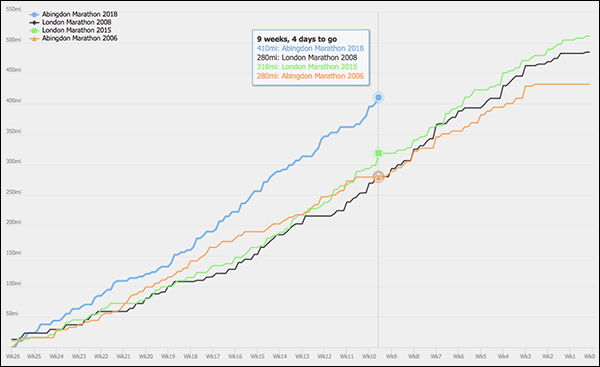
Pre-race Training Analysis
See your accumulated mileage in the weeks leading up to any event in your portfolio, and compare it to your other performances
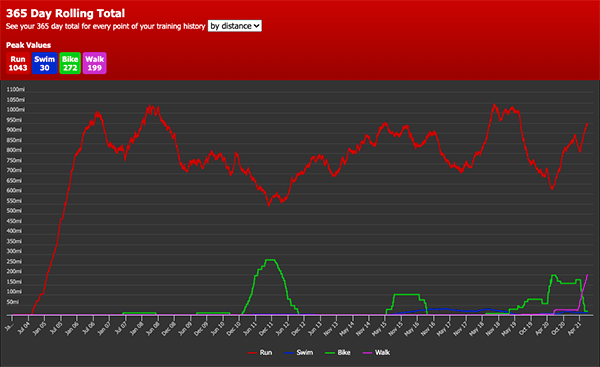
Your 365 Day Totals
Peaks and troughs in training aren't easy to find. Unless you use this graph. Find out what your peak training volume really is
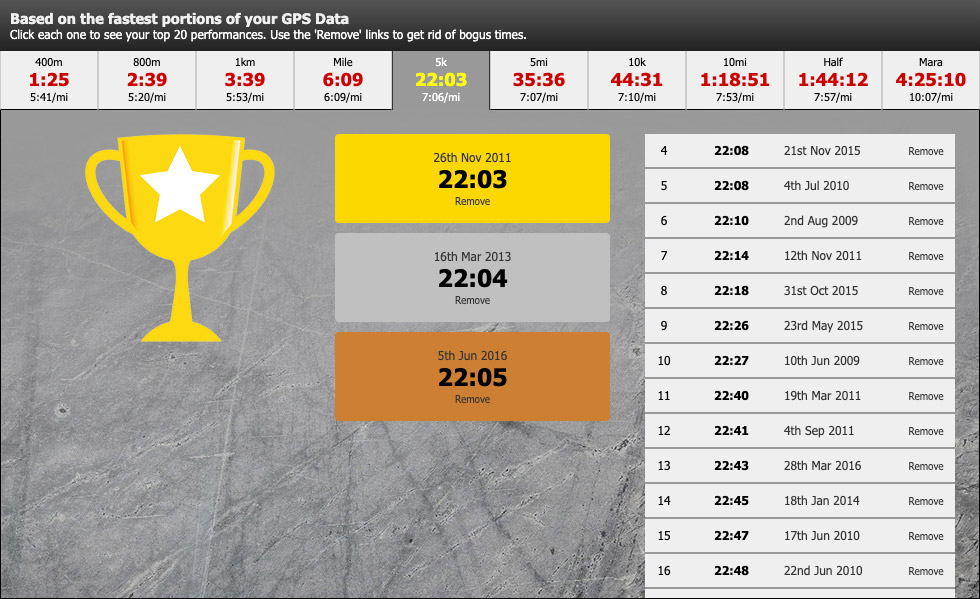
Benchmarks
See the fastest portions from all your training runs. Filter by time to give you recent bests to aim at. Every distance from 400m to marathon.
Fetch Everyone Running Club
Join our UKA-affiliated club for event discounts, London Marathon ballot places, the chance to get funded for coaching qualifications, and a warm feeling inside.
Leave a comment...
-
I have improved a lot with more lsr's and a 4:1 regime once a week . Good article
 x
x
oldbiddy
-
In your 40 minute comparison chart ranging from 190 miles to 300 odd miles of training, could you compare what races they did in the future after the 10k (say within a 3 month period after) to see if they may have been training for something else that was longer and just happened to do a 10k as part of their overall training? otherwise good study

*Anj*
-
Excellent article
Huntsman
-
Keep mining that data. I think you are on to something, Ian. In this case, I agree with Anj, the conclusions would be be better supported if you could identify, and possibly excluding, those who are training for a different distance as their target, and have simply incorporated a 10k into their training. Also, I would be very interested to see an accounting for the ages of the runners. I am wondering about the differences in the effects of total training miles, rest days, and training intensity for runners at different ages.
Sweaty Frank
-
Anj & SF - you've both hit upon the one thing that frustrated me the most whilst putting this together - graph #3, and all those unknowable variables that help define that wide distribution. I tried plenty of things, but couldn't find anything conclusive. I can try looking at 'PB's on the way to something else', as you've suggested.
fetcheveryone
-
I love it when i have a good idea

*Anj*
-
Of course, the alternative to hitting a PB on the way to a bigger event as a way of explaining the wide distribution is that folk run a 10k as the first race back after a Spring Marathon that they have trained hard for and have the residual fitness from the trainign for the marathon. Great set of stats though Ftech!
DeeGee
-
I'm sure you can make stats fit any particular argument, however, when I plot my run distances and run pace against the graphs, the times are uncannily accurate! Does that make me very average? :-s
Dillthedog
-
I like your conclusions but as Dillthedog says, not sure that they can be drawn from the data presented!
 We have quite a few anomalies in how we log in Fetch e.g. Intervals (running faster than 10K race pace) if run as a continuous session including jog or static recoveries, show an average pace slower than 10K. Those can be key sessions for improving 10K pace, but wouldn't be apparent in your data. The total mileage volume might vary with where you are in training cycles too. Finally, not all races are races! Some of us (I'd say quite a few) will run a race as a social, or pacing a friend or relative and it would show as 'not a PB' or even 'missed a PB', which would not be true. But your graphs are pretty!
  G
G
HappyG(rrr)
-
The goal of the final graph is not to prescribe minimum and maximum training paces, but to show that there is a wide variation no matter what standard you're aiming for. I did at one point have a sentence where I explained the anomalies in logging, but with my limited skills I felt that the cumbersome explanation drew away from the key point - but perhaps I was wrong to leave it out. Regarding the final point, I believe I've taken 'social' racing into account by the exclusion of races where the runner did not PB, and by trimming out the 'finding your feet' races.
fetcheveryone
-
I like the pretty graphs
 but I'm rubbish with stats
Corrah
-
Thanks for this insight. Handy.
Grid
-
I'd be really interested to see some breakdowns of training based on something other than pace and miles: for example, WAVA instead of race pace, or training hours instead of training miles. I'd bet that those of us who are older, slower, or non-male may show different results based on different metrics.
Drell
-
Interesting article, but you could set up a study, rather than looking at retrospective data. Why not, with individual's consent, take this a stage further, pick a popular race, such as the London marathon, and set up the 'fetch VLM study'. Where you can compare like with like as regards long runs, recovery runs and their paces and interval sessions. You would need to set up some rules in how their runs are recorded, but this approach might remove some of the anomalies noted.
Ocelot Spleens
-
Drell has a couple of good points there too, age/WAVA, and male/female must come into it......
Ocelot Spleens
-
Very interesting article, thanks. Interesting how the mileage graph (2) seems to 'kick up' once you get below around 40 mins, perhaps suggesting that times above 40 mins are more likely to be predicted by natural ability where as times below are more likely to be predicted by training volume??
gregw
To comment, you need to sign in or sign up!